1、简述
本文讲述如何应用callgrind和kcachegrind进行性能分析。该工具可以方便分析出可执行文件函数的执行时间及函数调用关系。通过充分利用工具,来提供我们的工作效率。
主要参考:性能分析工具使用-callgrind+kcachegrind
2、KCachegrind下载
KCachegrind是个图形化界面,主要用于对callgrind分析来的数据进行可视化。
https://sourceforge.net/projects/kcachegrind/
KCachegrind visualizes traces generated by profiling, including a tree map and a call graph visualization of the calls happening. It’s designed to be fast for very large programs like KDE applications.
来自 https://sourceforge.net/projects/kcachegrind/
http://kcachegrind.sourceforge.net/html/Home.html
https://kcachegrind.github.io/html/Home.html
Kcachegrind下载:http://kcachegrind.sourceforge.net/html/Download.html
Qcachegrind下载:https://sourceforge.net/projects/qcachegrindwin/
3、分析过程
3.1、安装valgrind和KCachegrind
首先安装valgrind:https://www.valgrind.org/
(1) 获取源代码:wget http://www.valgrind.org/downloads/valgrind-3.14.0.tar.bz2
(2) 解压缩: tar -jxvf valgrind-3.14.0.tar.bz2
(3) 进入目录,进行安装,其中/home/user1/valgrind是你想安装的目录
cd valgrind-3.14.0
./configure --prefix=/home/user1/valgrind
make
make install
(4) 配置环境变量,首先打开~/.bashrc
vim ~/.bashrc
export PATH=$PATH:~/valgrind/bin/
source ~/.bashrc
然后安装Kcachegrind:
Kcachegrind下载:http://kcachegrind.sourceforge.net/html/Download.html
3.2、利用valgrind生成性能日志
valgrind --tool=callgrind ./test_demo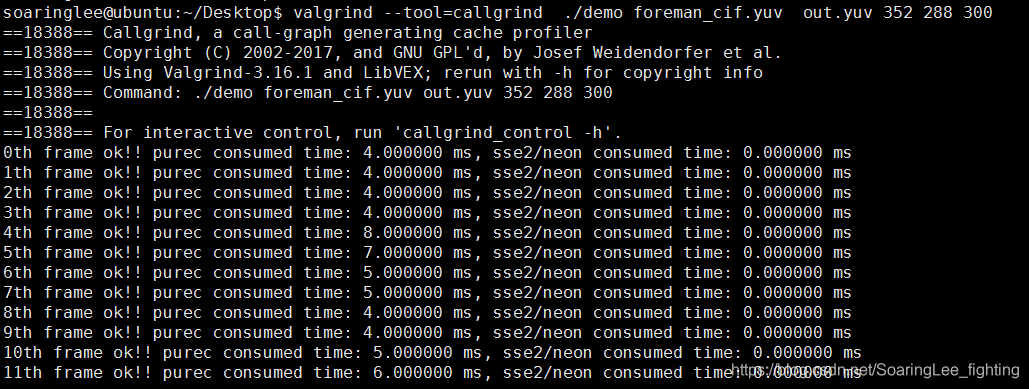
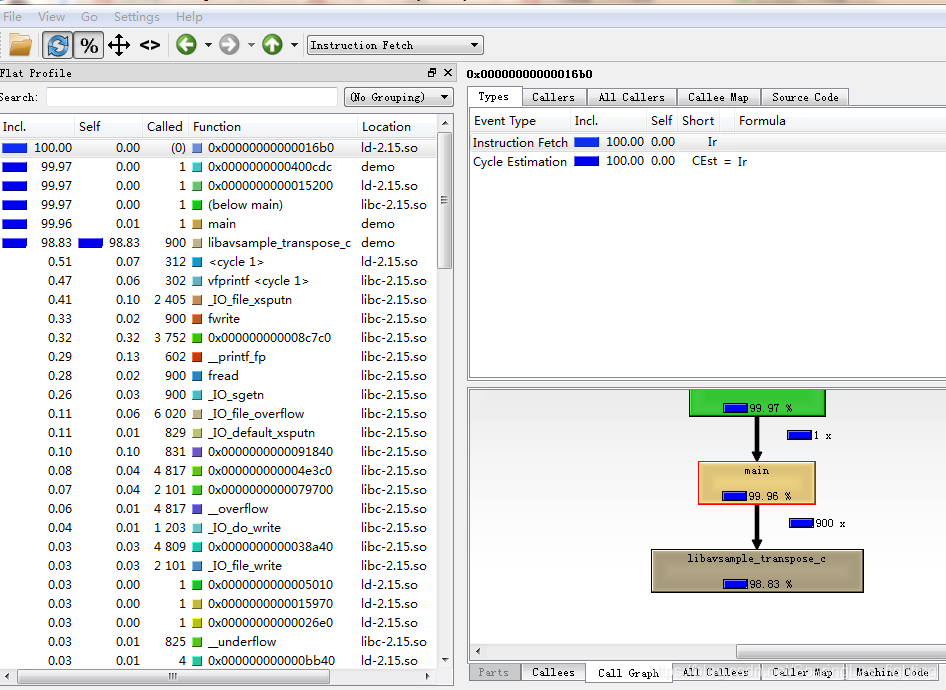
3.3、利用kcachegrind可视化
THE END!
本博文只能阅读,谢绝转载,欢迎指出任何有错误或不够清晰的表达。可以在下面评论区评论,也可以邮件至 2963033731@qq.com


